Here we present several paradoxes regarding environmental emissions in supernetworks, in which certain links correspond to telecommunication links and are characterized by a zero emission factor. By a zero emission factor, we mean that, irregardless of the flow on such links the total emissions generated by the use of such links is zero.
We identify three distinct paradoxical phenomena that can occur in such networks, which demonstrate that so-called improvements to the network may result in increases in total emissions generated. These paradoxes were discovered by Nagurney and Dong and published in a paper in the journal Transportation Research D in 2001.
Paradox 1: The Addition of a Zero Emission Link Results in an Increase in Total Emissions with No Change in Demand
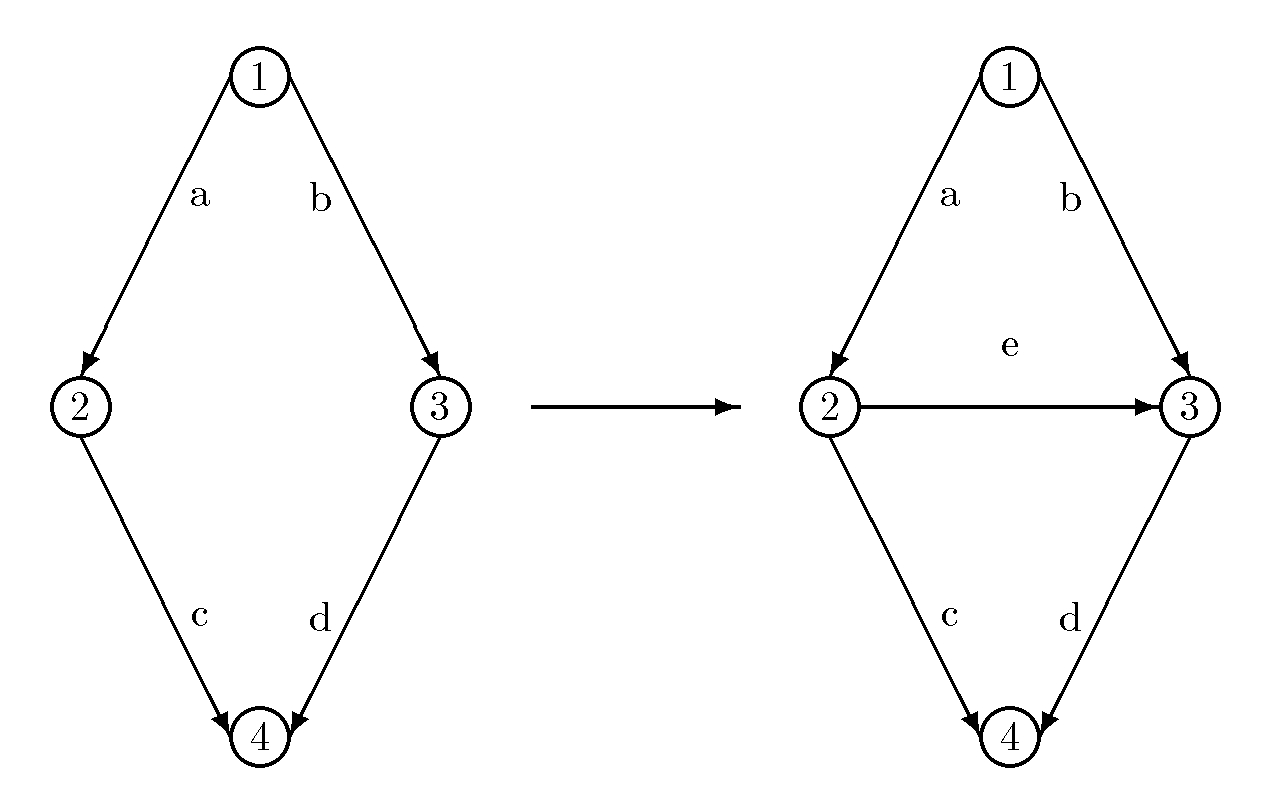
We first consider the network below which has the Braess (1968) network topology and user link cost structure.
There are 4 links: a, b, c, d; 4 nodes: 1, 2, 3, 4, and a single origin/destination pair of nodes (1,4) in the first network. There are, thus, 2 paths available to users between this O/D pair: p1=(a,c) and p2=(b,d). The user link cost functions are: ca(fa)=10fa, cb(fb)=fb+50, cc(fc)=fc+50, cd(fd)=10fd, where fa denotes the flow on link a, fb denotes the flow on link b, and so on.
The demand for the origin/destination pair is given by dw=6. Assume that the emission factors on the links are given by: ha=.2, hb=.1, hc=.1, and hd=.2. This means that the total emissions generated on link a, given a flow of fa on it would be hafa, and so on, for the other links.
The user-optimized flow pattern, under which the network is in equilibrium with no user or traveller having any incentive to alter his travel path, is given by: xp1*=3, xp2*=3, with equilibrium link flows: fa*=3, fb*=3, fc*=3, fd*=3, and with associated equilibrium path costs: Cp1=83 and Cp2=83. The total emissions generated by the equilibrium link flow pattern is: E=.2(3)+.1(3)+.1(3)+.2(3)=1.8.
Now, as illustrated in the figure above, consider the addition of a new link e, joining node 2 to node 3 to the original network. Assume that link e has an emission factor he=0 and a user cost function associated with traveling on link e given by ce(fe)=fe+10. The addition of this link creates a new path p3=(a,e,d) that is available to the users of the network. Assume also that the demand dw remains unchanged at 6 units of flow.
The equilibrium path flow pattern on the new network is: xp1**=2, xp2**=2, xp3**=2, with equilibrium link flows: fa**=4, fb**=2, fc**=2, fe**=2, fd**=4, and with associated equilibrium path costs: Cp1=Cp2=Cp3=92.
The total emissions generated in the new network are equal to 2, a value
greater than the total generated in the original network. Hence, the addition
of a new link with zero emissions makes not only everyone worse off in
terms of cost but also in terms of the emissions generated.
Paradox 2 - A Decrease in Demand on a Supernetwork with a Zero Emission Link May Result in an Increase in Emissions
We now illustrate a second paradox regarding a supernetwork with a zero emission link in which a decrease in the demand for an origin/destination pair, joined by a single path consisting of a single link with a zero emission factor, results in an increase in total emissions.
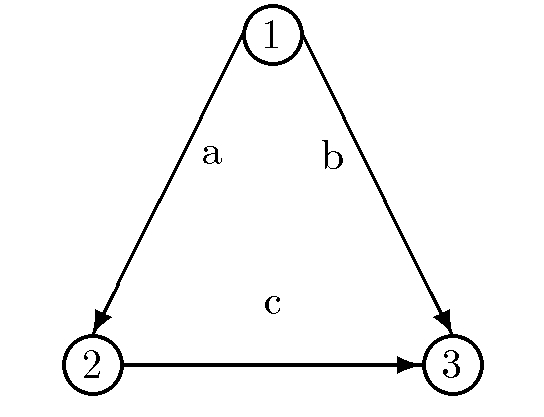
Consider the supernetwork depicted in the Figure below. The user link cost functions are: ca(fa)=fa+1, cb(fb)=fb+4, and cc(fc)=fc+1. There are two origin/destination pairs: w1=(1,2) and w2=(1,3). The path connecting O/D pair w1, p1, consists of the single link a. The paths connecting O/D pair w2 are: p2=(a,c) and p3=b. The demands in the original problem are: dw1=1 and dw2=2. The emission factors on the links are: ha=0., hb=.01, and hc=.5. Hence, link a may correspond to a telecommunication link.
The network equilibrium path flow pattern is: xp1*=1, xp2*=1, xp3*=1, with induced link flow pattern: fa*=2, fb*=fc*=1. The path user costs are: For O/D pair w1: Cp1=3, and for origin/destination (O/D) pair w2: Cp2=Cp3=5. The total emissions generated: E=.02+.01+.5=.51.
We now consider a decrease in demand associated with O/D pair w1 with the new demand dw1=.5 and all other data remain the same. The new network equilibrium path flow pattern is: xp1**=.5, xp2**=1.1666..., xp3**=.833..., with induced equilibrium link flow pattern: fa**=1.666..., fb**=.833..., fc**=1.166... The new path user costs are: For O/D pair w1: Cp1=2.666..., and for O/D pair w2: Cp2=Cp3=4.833.... The total emissions now generated: E=0.000...+.00833...+.5830=.59133....
Hence, the total emissions have increased from .51 to .59133... even though the demand has decreased. Moreover, the costs for paths between the two origin/destination pairs have decreased.
Paradox 3 - Adding A New Path which Consists Solely of a Zero Emission Link and which Shares No Links With Any Other Path May Result in an Increase in Emissions
We now illustrate a third paradox regarding a supernetwork in which the addition of a new path consisting solely of a zero emission links results in an increase in total emissions.
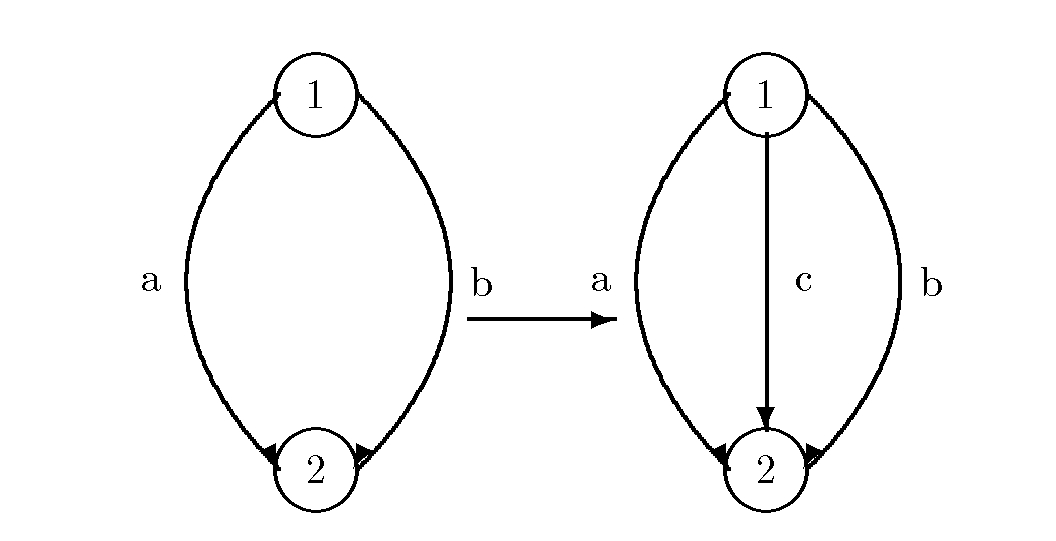
Consider the first network depicted in the Figure below. The user link cost functions are: ca(fa)=fa+10, cb(fb)=3fa+3fb. There is a single origin/destination pair: w1=(1,2). The paths connecting the O/D pair are: p1=a and p2=b. The demands in this network is: dw1=5. The emission factors on the links are: ha=0.1, hb=.5.
The network equilibrium path flow pattern is: xp1*=5, xp2*=0, with induced link flow pattern: fa*=5, fb*=0. The path user costs are: Cp1=15, and Cp2=15. The total emissions generated E*=.5+0=.5.
The new network equilibrium link flow pattern is: fa**=2,
fb**=2, and fc**=1. The user path travel costs are:
Cp1=Cp2=Cp3=12. The total emissions now
generated are given by: E=0.2 + 1.0+0.0=1.2. Hence, the equilibrium path
costs have decreased. However, the total emissions have increased from
.5 to 1.2 even though a new disjoint path (that is, a path that has no
links in common with any other path) with zero emissions was added.